
In the Spring
As I write this in mid-April, Spring’s arrival seems to be on indefinite hold. So, with apologies to Alfred Lord Tennyson who wrote that this might be a good time to think of love, my current thoughts are on something a bit less romantic: taxes.
No one has ever told me that they were happy to pay income taxes and agreed completely with how their money was being spent. Yet, despite our general frustration, we all understand that it’s our tax dollars which keep the country going, including the programs we love and those we hate. The IRS is charged with bringing in revenue to fund these operations. It did so to the tune of about $2.8 trillion in 2013 and I thought it might be interesting to see where those tax dollars go.
Our Social Security taxes are very easily understood. Payments into the SS system finance benefits to those who have already retired. Currently, SS tax revenues cover all retiree expenses and more. The excess has become the Trust Fund surplus about which we have all heard. Our SS taxes also cover a portion of the cost of Medicare which provides health insurance for retirees and others. The balance of those costs are covered by general federal revenue as we shall see.
Our income taxes are harder to understand as they support spending in multiple areas. The largest of these is the military at 32.1% including various veteran's benefits. Another 22.7% goes to assorted forms of healthcare, including the rest of the cost of Medicare and all of Medicaid. It requires 13.9% of our tax dollars to cover the interest on Uncle Sam's various debt obligations and unemployment benefits take up another 9.8%.
The remaining 21.5% of revenue goes to cover everything else, including 4.5% spent running the government and its agencies such as the IRS and the TSA. 4% goes to various housing programs and education gets 2% for Head Start, Pell Grants for college students, etc. Less than 2% is spent on scientific research, foreign aid, transportation and energy combined.
I got these percentages from the IRS’s 2012 Data Book and CNN. For those of you who’d like to see the details presented more finely, here’s a link to the National Priorities Project. This page allows you to enter your tax payment and state, then see where your money went in the form of a receipt. This exercise may not change many minds about how our money is spent but I think it’s worth the minute or so it takes.
In our truly global economy, I thought it might be interesting to take a quick look at some research by the accounting and consulting firm PriceWaterhouseCoopers (pwc) which compares US tax rates with those of most of the G20 nations. Thinking about people with average incomes, pwc found that our earners pay around 10.4% in income taxes compared to more like 34% in Denmark and 5.6% in the Czech Republic. China, Russia and Brazil would assess no taxes on the hypothetical family pwc studied.
Of course, our country’s spending decisions are made at the Congressional level. The invaluable Gallup Organization recently published a chart showing congressional approval ratings from 2011 through April 10th of this year. I doubt if the results will be a surprise to anybody:
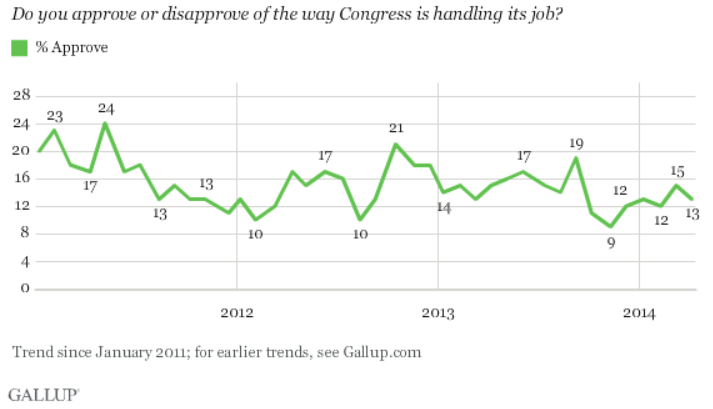
I suppose the good news for our elected employees is that their ratings have eased back into double digits from December’s pitiful 9%. Considering the general level of dissatisfaction, this would be a very good year to be sure you study the issues and positions, then vote.